Appearance
PyConsole supports visualization with plotly
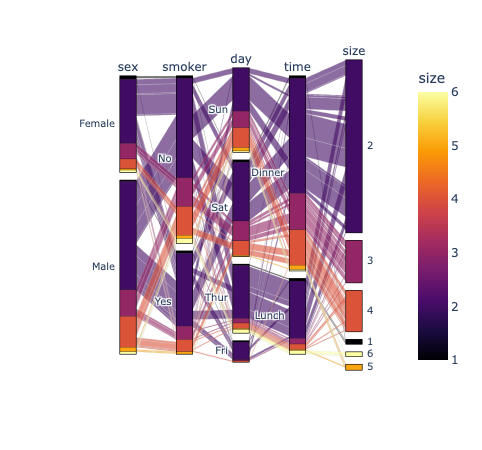
import plotly.express as px
df = px.data.tips()
fig = px.parallel_categories(df, color="size", color_continuous_scale=px.colors.sequential.Inferno)
fig.show
fig.show()