Appearance
Bokeh
PyConsole supports visualization with bokeh
Usage
Steps
- import data processing library and bokeh figure
python
import numpy as np
from scipy.integrate import odeint

from bokeh.plotting import figure- create bokeh figure
python
sigma = 10
rho = 28
beta = 8.0/3
theta = 3 * np.pi / 4
def lorenz(xyz, t):
x, y, z = xyz
x_dot = sigma * (y - x)
y_dot = x * rho - x * z - y
z_dot = x * y - beta* z
return [x_dot, y_dot, z_dot]
initial = (-10, -7, 35)
t = np.arange(0, 100, 0.006)
solution = odeint(lorenz, initial, t)
x = solution[:, 0]
y = solution[:, 1]
z = solution[:, 2]
xprime = np.cos(theta) * x - np.sin(theta) * y
colors = ["#C6DBEF", "#9ECAE1", "#6BAED6", "#4292C6", "#2171B5", "#08519C", "#08306B"]
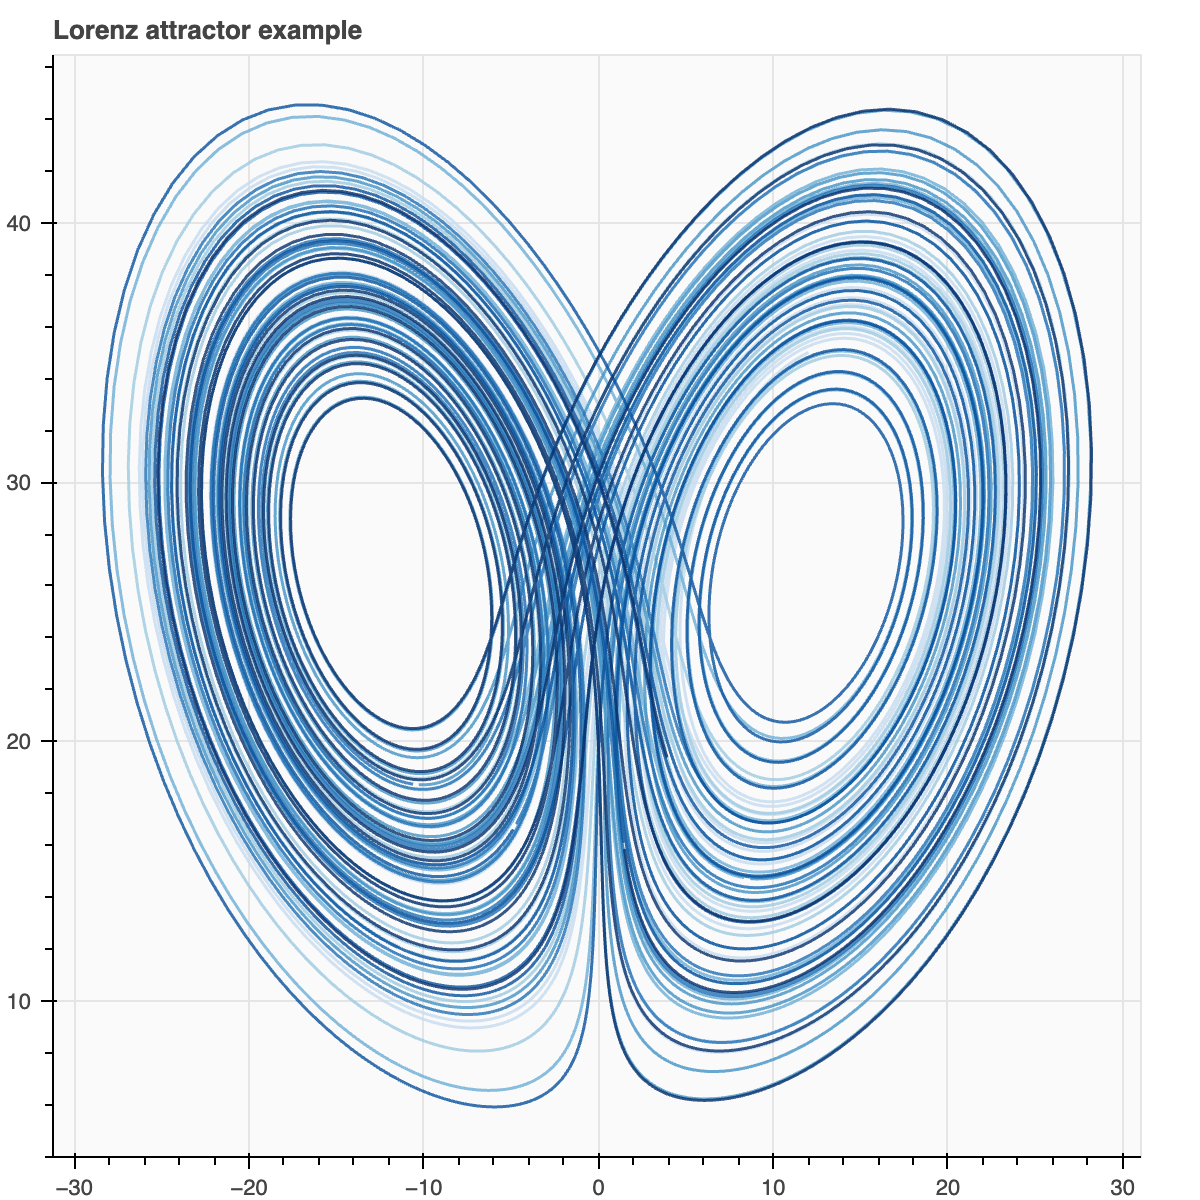
p = figure(title="Lorenz attractor example", background_fill_color="#fafafa")
p.multi_line(np.array_split(xprime, 7), np.array_split(z, 7),
line_color=colors, line_alpha=0.8, line_width=1.5)- show bokeh figure
python
p.show()